Analytics · AI Tools · Business Intelligence
AI Analytics Tools
for Small Business (Tracking, Not Just Analyzing)
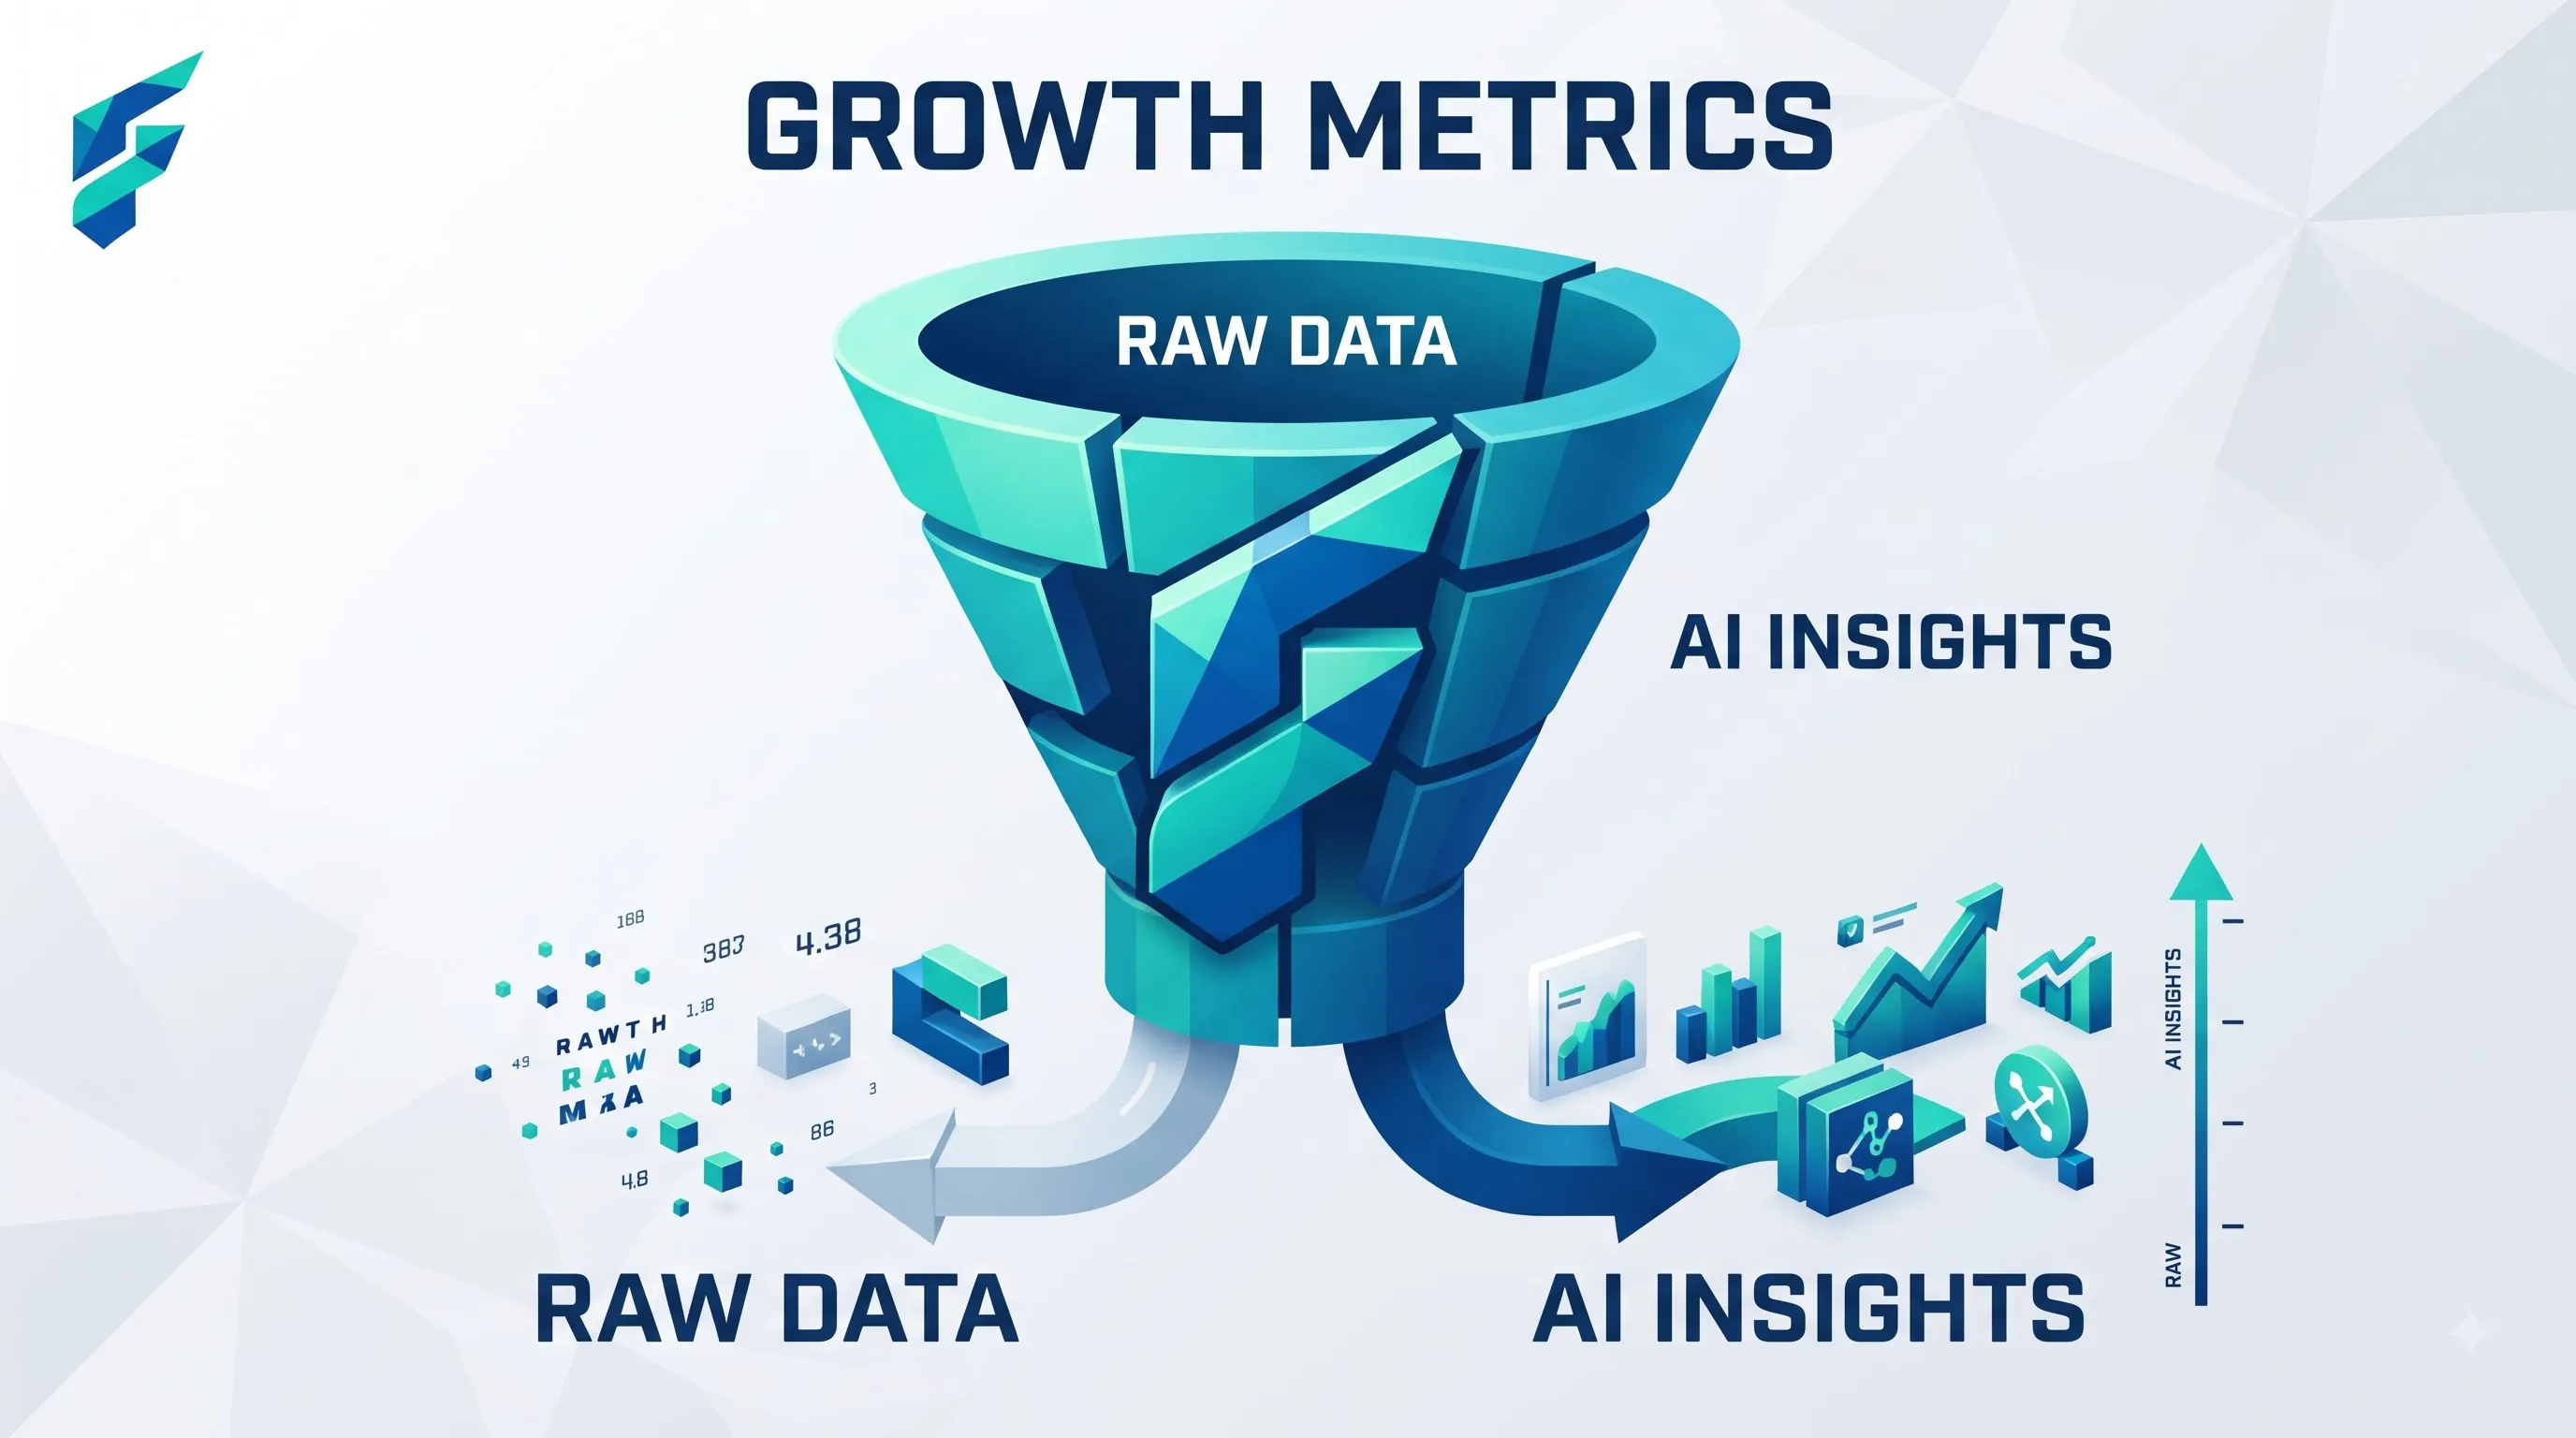
There's a real difference between analyzing your data once and tracking it continuously, and it's worth being clear about which one you actually need before you shop for a tool. Analysis answers a specific question about data you already have. Analytics is the ongoing dashboard that tells you, every day, whether the numbers that matter are moving the right direction.
Quick answer: If you're checking a handful of metrics regularly — website traffic, sales trends, marketing performance — an AI-enhanced analytics dashboard that updates automatically beats manually re-checking spreadsheets. If you're asking a specific, one-time question about existing data, a chatbot with file upload is faster and free. Most small businesses need a light version of both, not a heavy version of either.
What AI adds to a standard analytics dashboard
Plain-language summaries instead of raw charts
Rather than staring at a dashboard trying to spot what changed, modern AI-enhanced analytics tools will surface it directly: "traffic from social dropped 20% this week, mostly from Instagram" instead of you eyeballing five different graphs to find that yourself.
Anomaly alerts
Instead of checking daily out of habit, you get flagged automatically when something moves outside its normal range — a sales dip, a traffic spike, a sudden drop in email open rates. This is genuinely useful for catching problems early instead of a week late.
Answering follow-up questions on the spot
Good AI analytics tools let you type a question directly into the dashboard — "why did conversions drop last Tuesday" — instead of exporting data to analyze it somewhere else. This is similar to how AI data analysis tools let you ask specific questions about spreadsheets.
✅ Pro tip: Before buying analytics tools, try Perplexity or similar AI search tools to research what metrics matter most for your specific industry. They can help you identify which KPIs actually drive revenue versus vanity metrics.
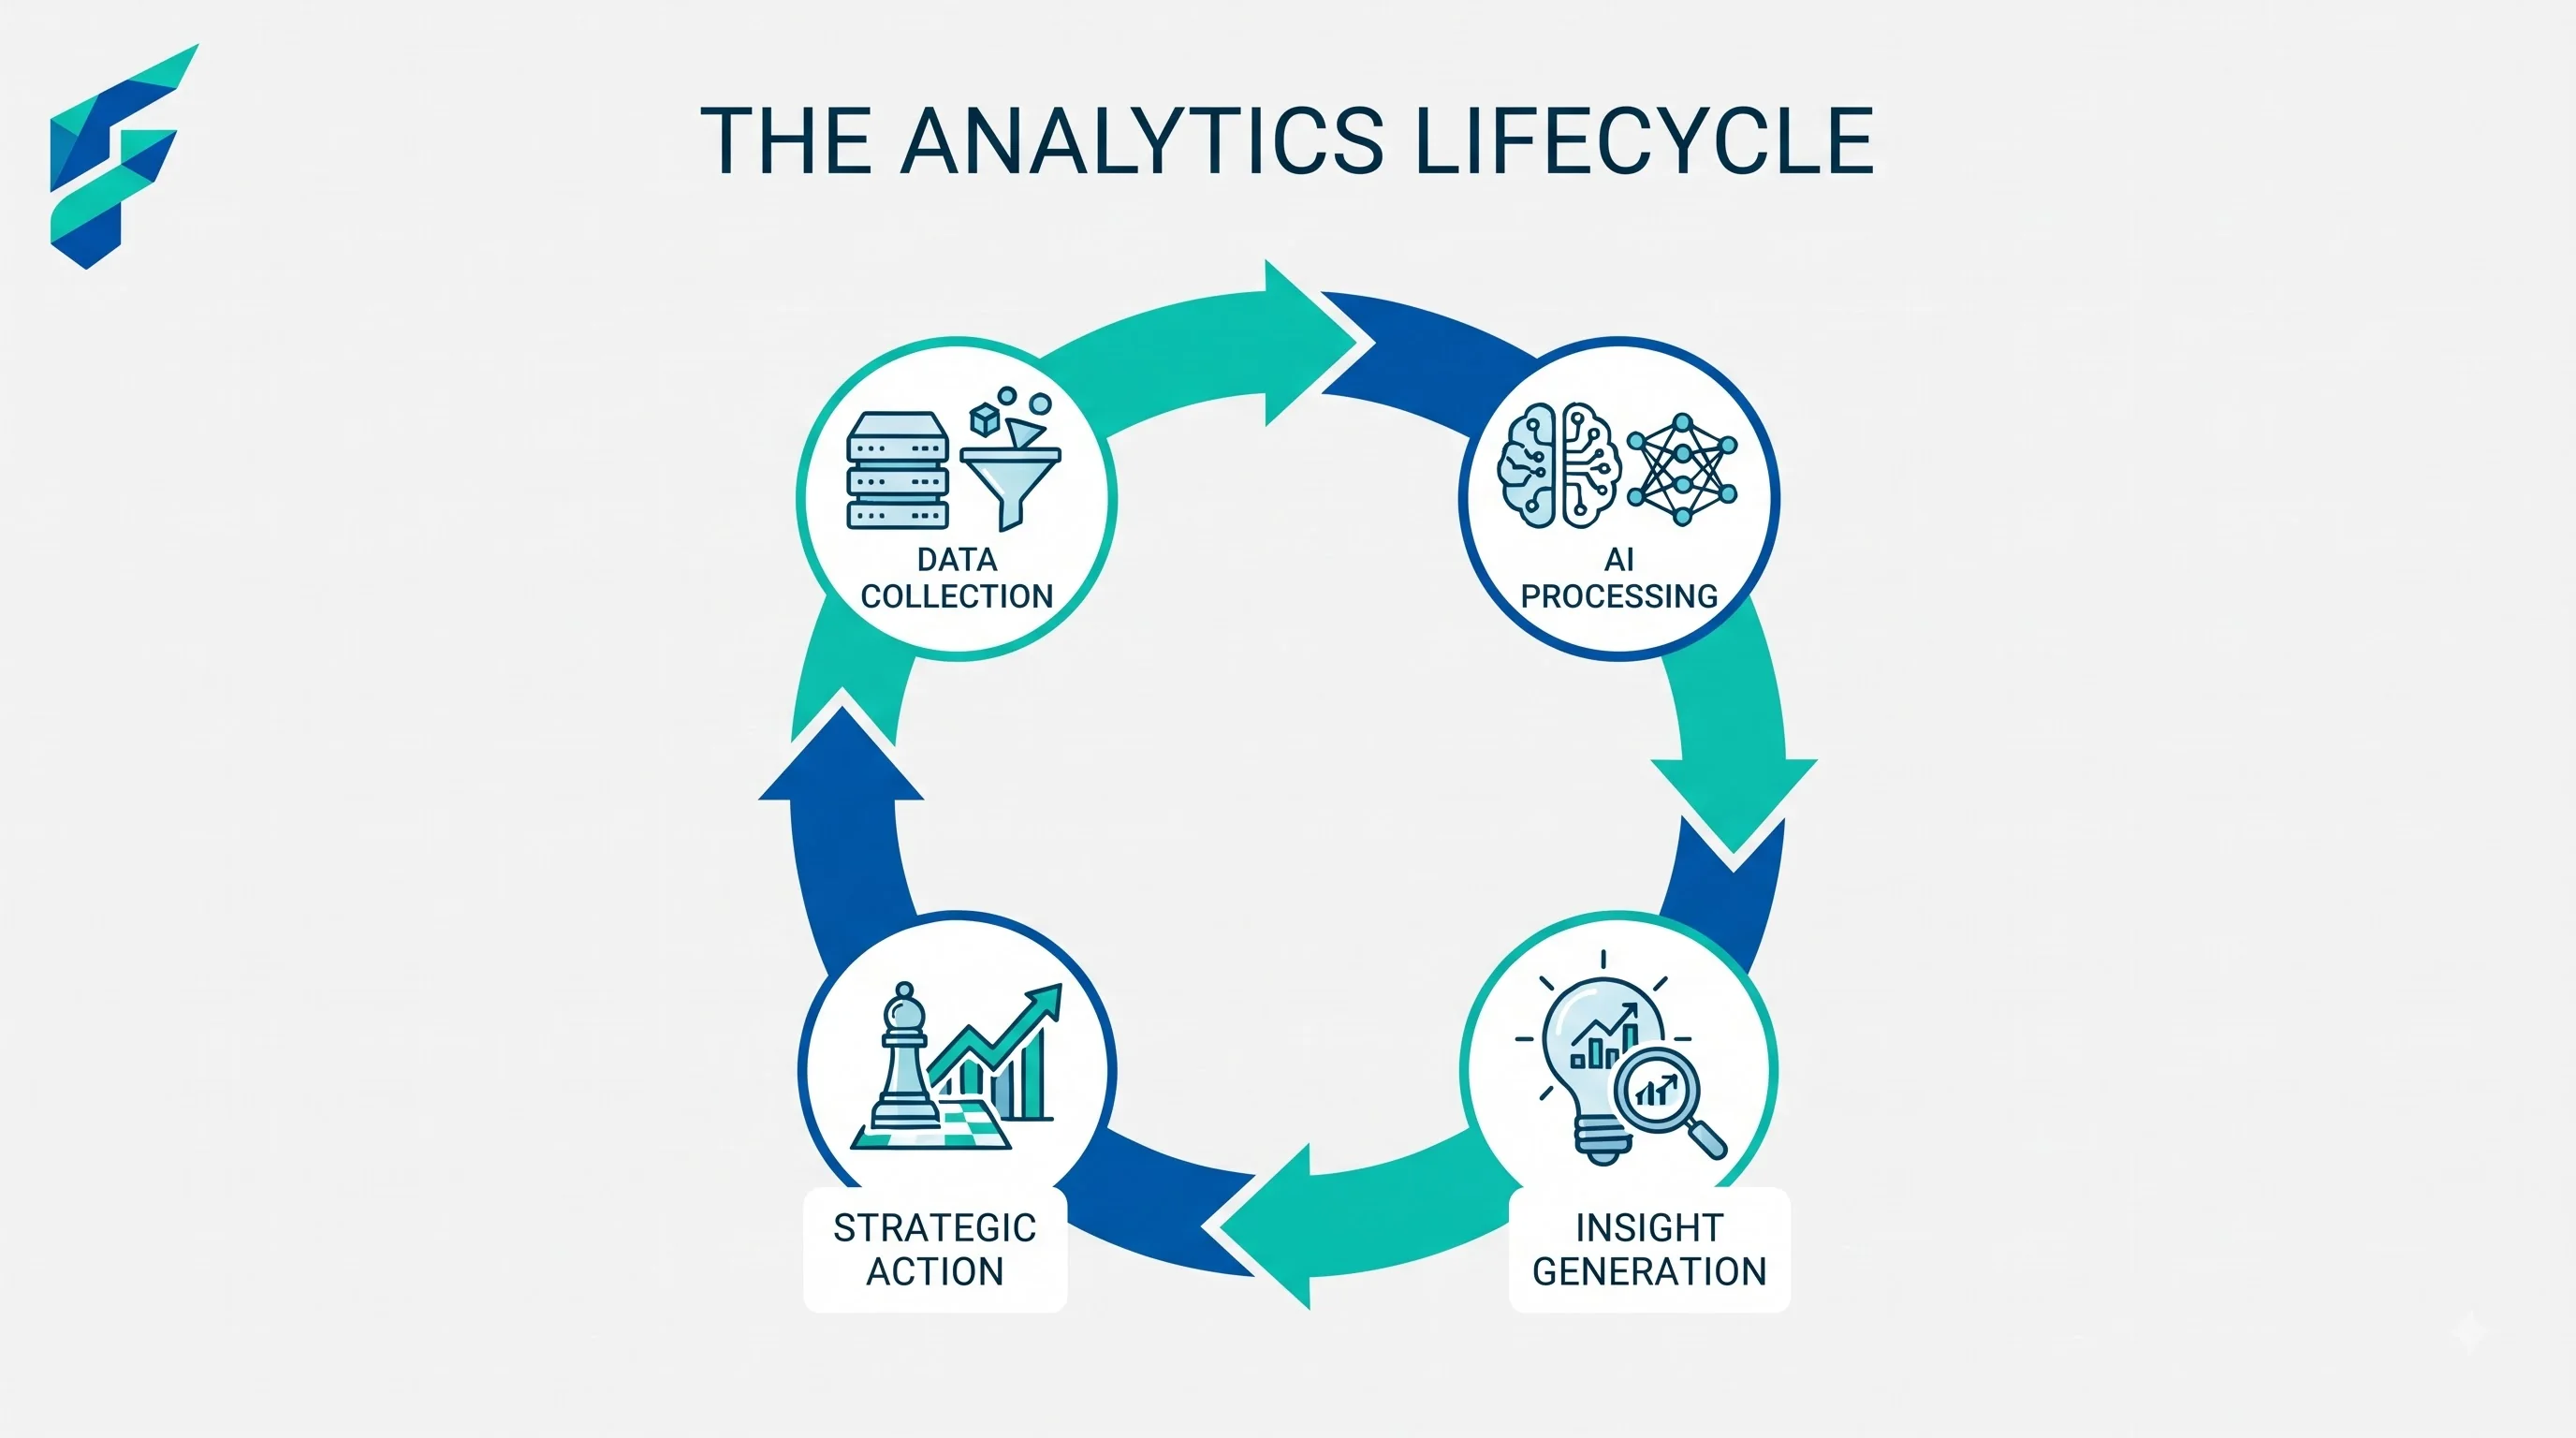
Which metrics are actually worth an ongoing dashboard
Not everything needs continuous tracking. Website traffic, sales trends, and marketing campaign performance genuinely benefit from a live dashboard because they change daily and small shifts matter. Things like annual revenue by category or year-over-year comparisons are better handled as periodic one-off analysis — setting up a live dashboard for something you check twice a year is unnecessary overhead.
This connects to how we approach AI workflow tools for small business — automate what changes frequently, analyze manually what doesn't.
Where free tools already cover this
Google Analytics (free) now includes AI-generated insights that flag notable changes automatically — most small businesses tracking website traffic don't need to pay for a separate analytics layer on top of it. Check what's already free and built into tools you use (your ecommerce platform, your email marketing tool, your social scheduler) before adding a paid dashboard tool.
I discovered last month that our email marketing platform (Mailchimp) had been generating AI-powered engagement insights for six months — I just never enabled the feature. It automatically flags which subject lines perform best and when our audience is most likely to open emails. That's $30/month I was about to spend on a separate analytics tool, completely wasted.
💡 Workflow integration: If you're already using AI email management tools, many include built-in analytics that track open rates, response times, and engagement patterns — often more comprehensive than standalone analytics platforms.
Where a paid tool earns its cost
Combining metrics across multiple sources into one view — sales, marketing, and website data in a single dashboard instead of four separate logins — is where paid AI analytics platforms genuinely save time. If you're manually cross-referencing numbers between tools every week, that's the signal to consider one.
Comparing your options
| Tool type | Best for | Typical cost | Real-time alerts | Combines multiple data sources |
|---|---|---|---|---|
| Free platform-native analytics (Google Analytics, POS dashboards) | Single-source tracking, most small businesses | $0 | Basic, improving | No, single source only |
| AI-enhanced dashboard tools | Cross-tool visibility, teams checking metrics daily | $20-150/mo | Yes | Yes |
| Spreadsheet + periodic AI review | Metrics checked monthly or quarterly, not daily | $0 | No, manual | Manual |
For teams that need better coordination around metrics, AI collaboration tools can help ensure everyone is looking at the same dashboards and understanding the same insights.
The realistic starting point
Before paying for anything, check whether the free analytics already built into your website, POS, or email platform covers what you actually need. Most small businesses discover it does — the paid layer only becomes worth it once you're tired of checking four different logins to get one picture.
My current setup: Google Analytics 4 with AI insights enabled (free), Shopify's built-in sales dashboard (included), and a simple weekly spreadsheet review for anything that doesn't need daily tracking. Total cost: $0. Total time saved versus manual checking: about 3 hours per week.
If you're ready to audit your existing analytics, start by listing every metric you currently check manually. Then check which platforms you already use that could track those automatically. Only after that should you consider paid tools. Check our Tool Finder filtered for analytics and business intelligence tools only if you genuinely need cross-platform visibility.